> For the complete documentation index, see [llms.txt](https://help.pixboost.com/llms.txt). Markdown versions of documentation pages are available by appending `.md` to page URLs; this page is available as [Markdown](https://help.pixboost.com/proper-performance-testing.md).
# Performance Testing
If you take a closer look at some leading online shops or web portals like real estate or online news websites, you could easily notice that images take up to one half of total transferred Internet traffic. Web developers work mostly on improving JS/CSS performance. But what about static content like images?
Thinking of it I came up with the idea to find a way to measure performance of images on a website. To demonstrate this method, I have created a [demo site](http://www.midday.coffee/original/cups.html) that looks like a typical listing page on an online shop. Sources of the website are publicly available on [github](https://github.com/Pixboost/midday-coffee). You are welcome to play with it as much as you want. After that you can apply your knowledge to your own website or page.
So, lets move on to the fun stuff.
## Performance Testing best practices
Before we dive into measurements let’s iterate through some common rules that are relevant for any performance testing:
* **Always do multiple measurements (more than 2).**
It’s important to make sure that data you collected are consistent. If you can see a major gap between measurements then something is not right, and therefore, you need to investigate a cause and repeat a test.
* **Conditions of the tests must be the same.**
Every time you are running tests make sure nothing changing externally. Some examples of external conditions could be the Internet speed, load of test server, etc.
* **Keep source data of load tests.**
If your input data is based on the end figures you are computing then it’s better to save source files as well. It might become important if you realize that your calculations are wrong or there is a missing metric.
* **Create test report.**
At the end of your tests you should have a report that you can store along with source data. That’s what you can use to compare results.
* **Run tests regularly.**
Performance testing shouldn’t be one time thing. Ideally you will want to run them on every change or on every release.
## Tools
In performance testing methodology is usually goes hand by hand with the tools. Sometimes those tools can be very expensive. But I will show you how to measure performance thoroughly and efficiently using open source tools and free apps.
So, that set of tool covers all our needs for today:
* Chrome Dev Tools
* HAR
* JQ
### **Google Chrome Dev Tools**
Our main tool would be**Google Chrome**which has some powerful developer features that can tell us a lot about what is going on.
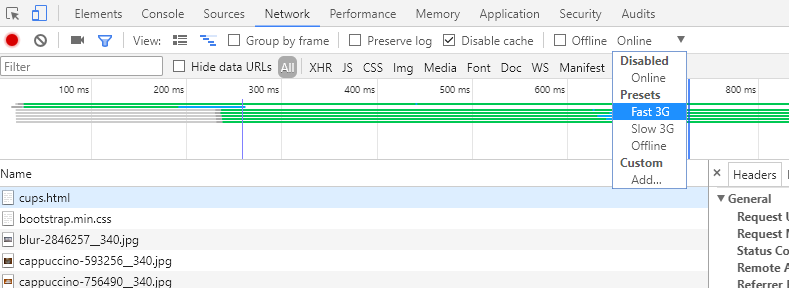
The network tab will be our best companion today. To enable it press**F12**in Google Chrome and click on “**Network**” tab.

Here we can see all network requests that have been done during the website load. We can get a lot of useful information for us, such as name of the file, size of the HTTP response and time that it take to load. So, we can collect all this information and analyze it.
### Export to HAR feature
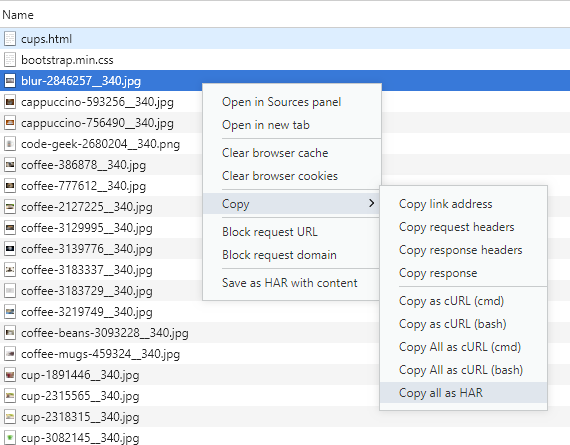
But instead of do it manually we can use another feature of Google Chrome Dev Tools — **export to** [**HAR**](https://en.wikipedia.org/wiki/.har):
HAR stands for “HTTP Archive Format” and describes HTTP requests and responses using JSON format. Below is one record from our requests (I removed some headers to make it shorter):
As you can see it provides very comprehensive set of data about the request. We can find URL of the image, all the headers and what is the most interesting for us — timings. Those HAR files are quite big and we don’t want to analyze them manually either.
### JQ command line tool
That’s where[**JQ**](https://stedolan.github.io/jq/)comes into a game. JQ is a command line tool that can process JSON files using special filters. It’s quite powerful and complex in the same time. For instance, if we want to print all images that has been loaded then we would write this in command line:
Let’s see what we are doing here.
\_.log.entries\[]\_is a selector that will pick every object from “entries” array and pass it down the pipe (|).
\_{“url”: .request.url }\_will create a new object for every array entry and will contain only URL os the request.
\_select(.url | match(“png|jpg|PNG|JPG|jpeg|JPEG”)\_will filter images out of all requests
## Setting up tests
Let’s see how we address all the requirements described above:
* We will do 3 measurements and make sure that deviation is not huge.
* Setup network throttling in Chrome Dev Tools, so that our tests won’t depend on the Internet speed.
* Disable caching. We can also do this in Chrome Dev Tools:

* Make measurements on 3 visual breakpoints: desktop, mobile and tablet
* Store all our measurements in a table that we will push to the repo with sources. A report will include all metrics, date and other parameters like visual breakpoint/device.
* Store all HAR files along with the report.
## Metrics
Now, when we have a source data and tools we can do actual testing. We are ready to**define our metrics**.
When dealing with web sites or applications the natural feeling is always to measure page load time. In fact it won’t give us accurate statistic data about images at all because certain factors can influence page load time:
* DOM
* Javascript/CSS scripts
* 3rd party analytics or marketing scripts
* On page script execution.
Instead of using generic metrics let’s think of metrics that will only be related to images and won’t be affected by anything else.
I have spent some time thinking and trying different approaches, and here are the list of metrics that I came up with:
* **Number of images on the page.**
By using this number you can track how many images are loaded on the page.
* **Total transferred size of images.**
This is a number of bytes that had been downloaded. It’s a good metric, and in most cases it can be improved really well by optimizing images or giving them a correct size (resizing or cropping).
* **Time taken for all images to load.**
This one shows us how long it takes for all images to load. It doesn’t take into account the fact that images load in parallel, but just if they would load sequentially. This metric also exclude queuing time that browser been waiting to start loading a resource.
* **Total time with queuing**
. This is the same as above but including queue time. Queue time can be reduced by using some techniques, for example, you can move all your assets to separate domain, so that browser can use different thread pool for loading your images.
## Let’s Do It
I prepared**some**(what scripts, define please!)JQ scripts that we will be using.
I added them to[github repo](https://github.com/Pixboost/har-jq-cheatsheet)for your convenience. They also could be easily modified in case you want to measure performance of other resources like JS/CSS.
There is a bash script that you can run by passing HAR file. It will print the statistic for all images.
Firstly, let’s load the[web page](http://www.midday.coffee/original/cups.html)3 times and save HAR files. Then run har-stat.sh script 3 times to get the results:
Then let’s put results into the report:
Now let’s change device to IPhone 7 and run the same tests. We can change device in Chrome Dev Tools:

Let’s capture values again:
Finally, we need to measure for tablet as well. At the end I put all source files and report into[git repo](https://github.com/Pixboost/midday-coffee/tree/master/performance-testing/original/cups/23-03-2018).
Once we published our report we can think of the test as done!
## Improving Images
And I’ll tell you how we can do this in the next article :)
## Conclusion
I hope this would be useful for you, so that you could see some real numbers before and after optimization. There are many manual steps in the process and I’m currently working on automating them all by running headless Google Chrome in the Docker. Feel free to contribute to a[git branch](https://github.com/Pixboost/har-jq-cheatsheet/tree/feature/docker-and-script).